
Butterfly
Win64, EnglishGeneral Usage Instructions
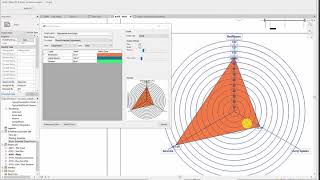
Click on the Generate Chart button to open up Butterfly charts dialog.
From this dialog, you can choose a Revit schedule under Data source settings and then pick two columns of the schedule in order to generate the graph.
The values under the Label column will be used to label the chart and the values under the Value column will be used as scalar information to generate the graph.
Choose one graph type from the Graph type menu.
A preview of the graph will be shown immediately when all information is provided.
Enter a name for the graph in the Graph name box and then click on Generate button to create the graph.
When a chart is created successfully the graph family will be loaded into the project and you must place it on a 2D view.
After the graph is created you can use the same dialog to modify the graphs or use the Refresh graphs command to update the graphs if the database (Revit schedule) has been changed.
Screenshots


Commands
Installation/Uninstallation
The installer that ran when you downloaded this app/plug-in from Autodesk App Store will start installing the app/plug-in. OR, simply double-click the downloaded installer to install the app/plugin.
To uninstall this plug-in, exit the Autodesk product if you are currently running it, simply rerun the installer, and select the "Uninstall" button. OR, click Control Panel > Programs > Programs and Features (Windows 7/8.1/10/11) and uninstall as you would any other application from your system.
Additional Information
Note: Uninstall the previous version from the system, before installing this version (0.3)
Known Issues
Contact
Author/Company Information
Support Information
Post your qouestions and inqueries on https://www.parametriczoo.com/index.php/discussion/revit-plugins/forum/butterfly/
Or email us at support@parametriczoo.com
Version History
| Version Number | Version Description |
|---|---|
|
0.3 |
Note in this version of Butterfly App the 3D Room diagram is deprecated. More charts are added. Data can be grouped. The chart can be created in both Image and Family form. |
|
0.2 |
In this version we have added Butterfly Graph! The Graph tool is a data visualization tool which creates graphical charts from Revit schedules. These charts can be customized and refresh at any time. With Graph tool you no longer need another software to create charts. Everything will be done inside Revit! |
|
0.1 |
Initial version. |
