
Coordinates UTM Grid
Descripción
Create a coordinates UTM grid on closed polylines. The coordinate grid will display lines and labels for the x-axis and y-axis. The labels will be positioned at the beginning and end of each line.
You can select as many polylines as you want, and the app will generate the grid within each polyline. To better organize the drawing, the app will create a group of objects for each coordinate grid (use the UNGROUP command to remove objects from the groups).
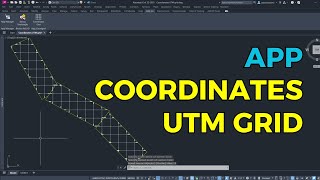
In the dialog box, you can configure all the grid properties. Start by choosing between a continuous grid or a grid with crosses. The continuous grid will draw lines throughout the limits of the polylines, while a cross grid will place crosses at the intersections of the lines (see screenshots for reference).
In the dialog box, you can set the line interval, text height, text style, x-axis and y-axis prefixes, and the layers for texts and lines. For the cross grid, you can also set the length of the lines.
After configuring the dialog box to your preferences, press OK, and the coordinate grids will be created in the drawing.


Works fine! Thanks for this!